Explainer · Feeds & Standards
How real-time arrival predictions actually work
The countdown on the sign is a prediction, not a readout of a bus you can see. Here is the data chain behind it, from the vehicle's GPS to the feed the sign reads, and the three ways agencies turn location into a time.
The countdown on a bus shelter that says the next one is three minutes out is a prediction. It gets recomputed many times a minute, and it is the visible end of a data chain most riders never see. A receiver on the bus reports where the vehicle is. A back-office system matches that position to the trip the bus is running and works out how far off schedule it is. A prediction engine projects that forward to every stop still ahead. The result is written into a standard feed, and the sign, or the app in your hand, reads the number off that feed and counts it down.
That framing matters because it tells you where things go wrong. When an estimate jumps from two minutes to seven, or a bus disappears from the map and then reappears, the fault is almost never in the sign. It is somewhere back along the chain: a stale position, a bus matched to the wrong trip, a schedule that no longer reflects a detour. The prediction is only ever as good as the data feeding it, so the useful way to understand real-time passenger information is to follow that data from the vehicle to the screen.
Where the number comes from
Two pieces of jargon carry most of the weight here, and they are easy to keep straight once you separate them. Automatic vehicle location, or AVL, is the part that answers a single question: where is the bus. In practice that is a GPS receiver on the vehicle reporting its position and a timestamp back to the agency on a short interval. On its own, a stream of coordinates is close to useless. A dot moving down a street does not tell a dispatcher whether the 47 is running late or which trip it is even on.
CAD/AVL is the system that gives those coordinates meaning. The label pairs computer-aided dispatch with automatic vehicle location, and it is the back office that most agencies actually buy: the software dispatchers watch, which ties each vehicle to its scheduled trip, measures how early or late it is running, and handles the radio and incident workflow around it. Location is the raw material. The schedule is what turns it into a fact a prediction can be built on. Everything downstream, including the number on the sign, depends on the back office matching the right bus to the right trip in the first place.
The data chain, end to end
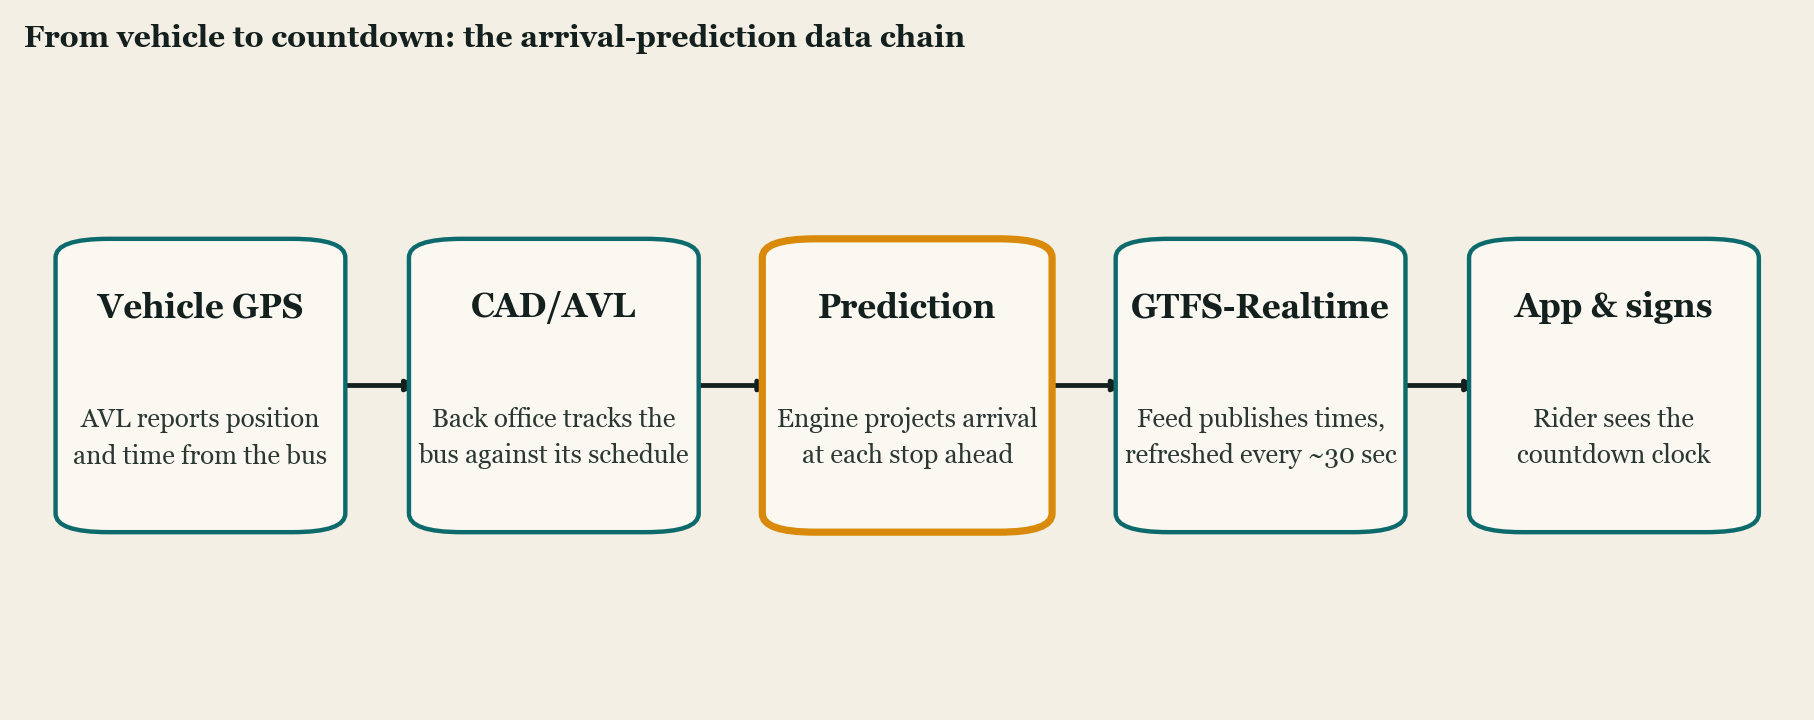
The feed at the fourth stage is, for most US transit apps, GTFS-Realtime, the live companion to the static GTFS schedule an agency already publishes. It is a Protocol Buffers format with three message types, and two of them do the work here. VehiclePositions carries the live location: latitude, longitude, bearing, and a timestamp for when the reading was taken. TripUpdates carries the predictions themselves, the arrival and departure times projected for the stops ahead. The sign reads TripUpdates; the map dot reads VehiclePositions.
Where the prediction engine sits varies, and it matters because it changes who is accountable when the number is wrong. Some CAD/AVL vendors compute the predictions in their own back office and publish finished TripUpdates directly. Elsewhere the agency publishes only raw VehiclePositions, and a separate layer, a third-party app or a hosted prediction service, consumes that location stream and computes its own arrival times. The rider cannot tell which they are looking at, but the two setups fail differently and are debugged in different places.
Freshness is the constraint that ties the chain together. The GTFS-Realtime best practices ask producers to refresh a feed at least once every 30 seconds, and to keep the data inside it no older than 90 seconds for trip updates and vehicle positions. Miss that and the prediction is being projected from a position the bus has already left, which is exactly how a countdown ends up ticking down to “due” while no bus is in sight.
What the feed actually says
A single predicted arrival in TripUpdates can be expressed two ways, and the choice
carries a quiet assumption. A stop’s timing can be given as a delay in seconds
relative to the published schedule, positive when the vehicle is running late and
negative when it is early, or as an absolute time. Delay only works for a
scheduled trip, because it means nothing without a schedule to offset from, and
if the feed leaves out a stop, the last stated delay propagates forward to every
following stop until a new value replaces it. That propagation rule is why a bus
stuck in one incident can throw off the estimate for a dozen stops at once.
The feed also has ways to say it does not know. A stop update can be marked
SKIPPED when the vehicle will not serve it, or NO_DATA when there is no
real-time information for that stop and the rider should fall back to the schedule.
And each predicted time can carry an uncertainty value, the expected error in
the estimate, which a producer sets to zero only for something it is sure of, like
a computer-controlled train. In practice most feeds omit uncertainty entirely, so a
confident estimate and a rough guess arrive looking identical. The rider sees a
crisp “4 min” either way, which is part of why the numbers feel more precise than
they are.
Three ways to turn location into a time
The interesting judgment is at the prediction stage: given where the bus is now, how do you decide when it reaches your stop. There are three broad approaches in use, and they trade simplicity against how much of the real world they try to model.
| Method | How it works | What it needs | Where it holds up | Where it breaks |
|---|---|---|---|---|
| Schedule deviation | Take the bus’s current lateness and carry it forward, adding it to the published schedule for every stop ahead | Live position and the static schedule | Simple and transparent, works from day one, fine over short horizons | Assumes conditions hold steady; blind to recurring congestion, dwell time, and time-of-day patterns; drifts on longer legs |
| Historical and statistical | Learn typical run times per segment and time of day from archived trips, then blend that with the live position; Kalman filters update the estimate with each new reading | A clean archive of past AVL data | Captures recurring patterns like the evening peak and school dismissal; adapts as new readings come in | Needs good history; struggles with events outside the pattern, such as incidents, detours, and weather |
| Machine learning | Fit nonlinear relationships across many inputs at once (segment, time of day, headway, weather) from large datasets | Large, clean, labeled datasets and the engineering to keep them current | Can model interactions the simpler methods miss and, at scale, tighten the estimate | Data-hungry and hard to inspect; degrades quietly when its inputs drift; the payoff depends on data quality |
Those map onto the feed in a direct way. A schedule-deviation method is really just
computing a delay; the historical and machine-learning methods usually produce an
absolute time, because they are no longer reasoning about the schedule as a
baseline at all.
The machine-learning column is where the AI framing lands, and it is worth being precise about what it buys. In one 2023 study on New York City bus data, a neural network trained across more than 200 routes held its average error under about 40 seconds, which is a strong result for a single citywide model. The same work shows the catch, though. The accuracy comes from volume and clean labeling, and a simpler regression that does fine on a handful of routes became untrainable as the network grew. A learned model is only as good as the location and schedule data feeding it, and that is the same data a plain schedule-deviation method runs on. The intelligence is real, but it sits on top of the unglamorous parts of the chain, not in place of them.
Why the data layer decides the answer
Follow the chain back and every failure a rider notices has an origin upstream of the algorithm. A “ghost bus,” the predicted arrival that counts down to zero and then never comes, is usually not a bad prediction at all. It is a vehicle matched to a trip it is no longer running, or a stale position that the feed kept serving past its useful life. An estimate that lurches around often means the schedule the agency published does not match the route the bus is actually driving, so the deviation calculation is measuring against the wrong baseline. None of that is fixed by a better model. It is fixed by cleaner location data, correct trip assignment, and a feed that expires stale entries on time.
This is why arrival prediction belongs to the feeds-and-standards conversation more than the AI one. The parts that a rider credits to smart software are mostly a matter of feed hygiene: are the positions fresh, is each bus on the right trip, does the real-time feed agree with the static schedule it is layered over. Get those right and even a basic method predicts well. Get them wrong and the most sophisticated model on the market will confidently tell people to run for a bus that was cancelled twenty minutes ago.
What to watch
Machine-learning prediction is spreading, both inside CAD/AVL products and in the third-party layers that resell predictions to agencies, and on clean, high-volume networks it does measurably better than a deviation carried forward. The binding constraint is the data, not the math, so the agencies that benefit most are the ones that already keep their positions fresh and their trip assignments honest. A second thing to watch is whether feeds start populating the uncertainty field they already have, which would let apps show a range instead of a single confident number and set expectations more honestly. This is a moving area, so treat the specifics here as a snapshot of mid-2026.
The through-line does not move, though. A real-time arrival is a short pipeline with one clever step and several boring ones, and the number on the sign is only ever as trustworthy as its weakest link. The work that decides whether riders believe the countdown is not the prediction method. It is the quality of the location and schedule data underneath it.
Common questions
- How do real-time bus arrival predictions work?
- A receiver on the bus reports where it is, a back-office system matches that position to the trip the bus is running and works out how far off schedule it is, and a prediction engine projects arrival at each upcoming stop. The countdown on the sign is the visible end of that data chain.
- Why are bus arrival predictions sometimes wrong?
- The fault is almost never in the sign. It is back along the data chain: a stale position, a bus matched to the wrong trip, or a schedule that no longer reflects a detour. The prediction is only ever as good as the data feeding it.
- What feed carries the prediction to the app?
- For most US transit apps it is GTFS-Realtime, refreshed continuously. Freshness is the constraint that ties the chain together, so a feed that stops updating turns a good prediction stale.