Explainer · Quality & Compliance
What the National Transit Database actually holds
The NTD is the federal record of US public transit: who rides, what it costs, and who has to report. Here is what it holds, who files it, and how to pull the numbers yourself.
The National Transit Database is the federal record of public transportation in the United States. Nearly every transit agency that takes federal formula money reports to it, on a fixed schedule and in a fixed set of categories, and the result is the most complete single picture of who rides transit, what the service costs, and how it is holding up. The Federal Transit Administration runs it, and it exists because Congress tied the money to the reporting. Under 49 U.S.C. 5335, FTA maintains a national reporting system and a uniform system of accounts, and it may award a grant under the urban or rural formula programs only if the applicant, and any agency that benefits directly from that grant, report into those systems.
That last clause is what makes the NTD different from a voluntary industry dataset. It is a condition of funding, so the coverage is close to complete and the definitions are the same from one agency to the next. When you compare Houston to Boston in the NTD, you are comparing numbers built to the same rules. That comparability is the whole point, and it is the reason the database is the baseline most serious transit analysis starts from.
What the database actually holds
The NTD is organized around a handful of things every reporting agency has to describe each year. Service is one: vehicle revenue miles, vehicle revenue hours, and the count of vehicles operated in maximum service, broken out by mode and type of service. Ridership is another: unlinked passenger trips (one boarding equals one trip) and passenger miles traveled. Finances are a third: operating expenses, fare revenue, and funding sources by level of government. On top of those sit capital assets and their condition, and safety and security events. Since report year 2023, fixed-route reporters also have to maintain a public GTFS feed and hand FTA a link to it, so the database now carries a machine-readable description of where the service actually runs.
The national totals give a sense of the scale. The figures below are aggregated from FTA’s NTD annual data for report years 2022 through 2024, the three most recent years published.
| National totals | 2022 | 2023 | 2024 |
|---|---|---|---|
| Unlinked passenger trips | 5.96 billion | 6.99 billion | 7.67 billion |
| Passenger miles traveled | 29.9 billion | 35.0 billion | 38.0 billion |
| Operating expenses | $53.7 billion | $60.5 billion | $65.6 billion |
| Fare revenue | $8.9 billion | $10.4 billion | $11.3 billion |
Two things stand out. Trips grew about 17 percent from 2022 to 2023 and kept climbing into 2024, so the recovery was real and continuing. And the gap between fare revenue and operating cost is wide: in report year 2024, fares brought in $11.3 billion against $65.6 billion in operating expenses, so fares covered roughly 17 percent of the cost of running service. The rest came from public funding, which is exactly the money the NTD numbers help apportion. Operating expenses here exclude capital spending, which the database tracks separately.
A record of the recovery
Because the NTD is a time series, it is also the cleanest record of what the pandemic did to transit and how far the rebound has gone. The chart below sums the monthly ridership data product to a national figure for each calendar year, 2014 through 2025.
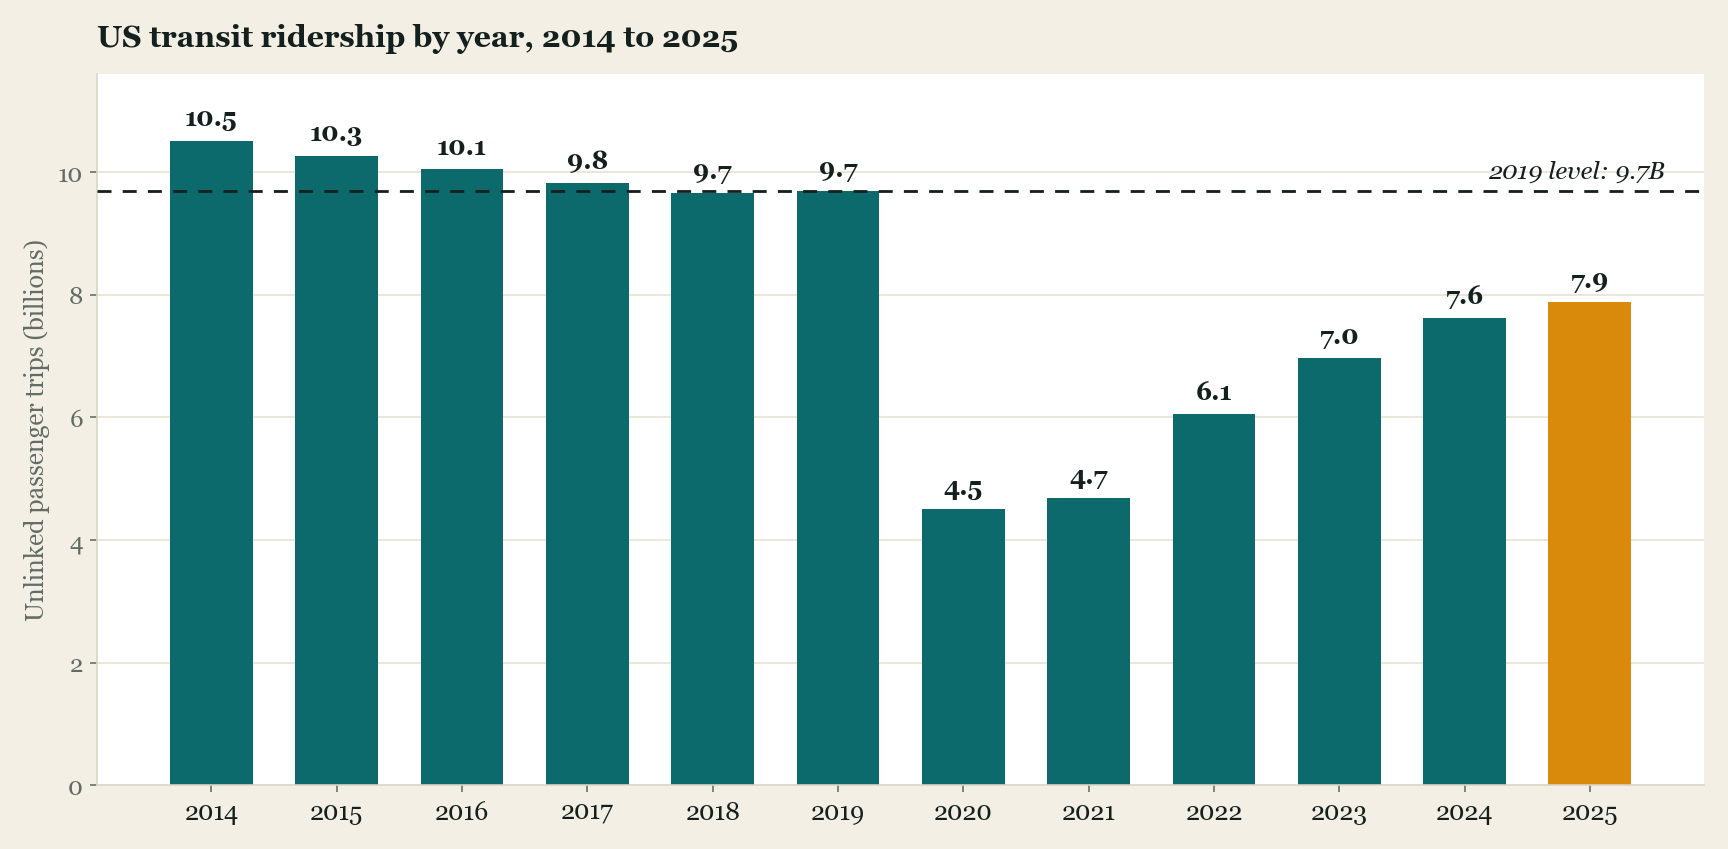
One caution on reading the chart against the table above. The monthly ridership product covers urban full reporters, while the annual database covers every reporter, so the two series differ by about a percent in any given year. For 2023 the monthly total lands near 7.0 billion and the annual total at 6.99 billion, close enough to tell the same story and different enough that you should know which product produced which number.
Who has to report, and when
Not every agency files the same thing. The NTD sorts reporters into a few types, and the line that matters most runs at 30 vehicles. An urbanized-area agency that operates more than 30 vehicles in maximum service, or that runs any rail or fixed-guideway service, is a full reporter and files the complete annual package. Smaller urban agencies and rural operators file less.
| Reporter type | Who it covers | What they file |
|---|---|---|
| Full Reporter | Urbanized-area agencies operating more than 30 vehicles in maximum service, or any rail or fixed-guideway mode | Full annual report plus monthly service data |
| Reduced Reporter | Urbanized-area agencies with 30 or fewer vehicles and no fixed guideway | A shorter annual report (the RR-20 form) |
| Rural Reporter | Operators funded under the rural formula program, filed through their state DOT | Annual rural-module report |
| Tribal Reporter | Tribes receiving Tribal Transit Program funds | Annual report |
The cadence follows from the type. Every reporter files an annual report after its fiscal year closes, certified by the agency’s chief executive, and that report is the detailed one: finances, service, assets, safety. Full reporters also file service data every month, which is what feeds the ridership product. FTA publishes that monthly data on roughly a two-month lag, so in the middle of July 2026 the latest month available was May 2026. Agency fiscal years do not all end in December, which is why the annual report year and the calendar-based monthly module never line up perfectly.
The reporting requirement has teeth. Under 49 CFR Part 630, an agency that fails to report can be found ineligible for further formula funding until it files. And the data does more than sit in an archive after it is filed. Full-reporter numbers, including passenger miles, feed the formula that apportions Section 5307 urban money, so the figures an agency reports help decide what it and its peers receive. That is a strong incentive to report carefully, and a reason to read the numbers knowing they were produced by the agencies they describe.
How to pull the data
There are two front doors. The NTD program pages on transit.dot.gov hold the reporting manuals and the packaged data products, and the open-data portal at data.transportation.gov holds the same data in interactive, queryable form. Which one you want depends on the question.
| Data product | Use it for |
|---|---|
| Annual Database | One report year in full detail: service, expenses, fares, assets, and safety, by agency and mode |
| Time Series files | Year-over-year trends, with one row per agency and a column per year |
| Monthly Ridership | The freshest ridership, updated monthly on about a two-month lag |
| Interactive data views | Filtering or querying online, or pulling figures through the portal’s API |
| National Transit Summaries and Trends | FTA’s yearly narrative read on what the numbers show |
For a specific agency in a specific year, the Annual Database is the place to start. For a trend, the Time Series files already stack the years for you. For the most current ridership, the monthly products beat the annual database by more than a year. Every dataset on the open-data portal also carries an API, so you can aggregate on the server rather than download a whole file. The national totals and the recovery chart in this piece were both produced that way, by summing reported figures across agencies straight from the portal.
The one habit worth building is matching the product to the unit. Report years are agency fiscal years and do not all align to the calendar. The monthly module is calendar-based and covers only urban full reporters. Mixing them without noticing is the easiest way to publish a number that is off by a percent or a year, which is enough to be wrong.
What to watch
The NTD keeps changing at the edges. FTA is tightening what agencies must submit, including geospatial route shapes inside the required GTFS feed, which pulls the database further into the standards world that transit data teams already live in. Safety and security reporting is the softer spot. That same notice clarified when agencies have to report cybersecurity events, which have reached the NTD only nine times since 2014, and like everything else in the database the safety numbers are only as complete as the agencies that file them.
Treat the specific numbers here as a snapshot of mid-2026, since report years 2023 and 2024 are the latest annual data and the monthly series runs a couple of months behind. The shape of the thing is stable, though. The National Transit Database is the standardized ledger of American transit, and knowing what it holds, who files it, and where the seams are will answer most questions before you build anything on top of it.
Common questions
- What is the National Transit Database?
- The National Transit Database (NTD) is the federal record of public transportation in the United States. Nearly every agency that takes federal formula money reports to it on a fixed schedule and in a fixed set of categories, which makes it the most complete single picture of who rides transit, what the service costs, and how it is holding up.
- Who has to report to the NTD?
- Nearly every transit agency that receives federal formula funding. Reporting is a condition of that funding, so coverage is close to complete and the definitions are the same from one agency to the next.
- What can you do with NTD data?
- Compare agencies on the same terms, because the numbers are built to the same rules. It is the baseline dataset for questions about who rides transit, what service costs, and how the system is holding up.