Quickstart
- Provision a deployment target (your cloud account, on-prem VM, or local host).
- Pull the node distribution. (Published with the public release.)
- Configure adapters for your data sources (signals, AVL/CAD, fare, ITS feeds).
- Start the node; verify the warehouse is populating and the API responds.
- Open the visualization layer and the MCP endpoint.
The visualization layer
Section titled “The visualization layer”Once the node is running, the visualization layer lets analysts query the normalized warehouse in SQL and assemble dashboards - the same primitives an MCP agent uses.
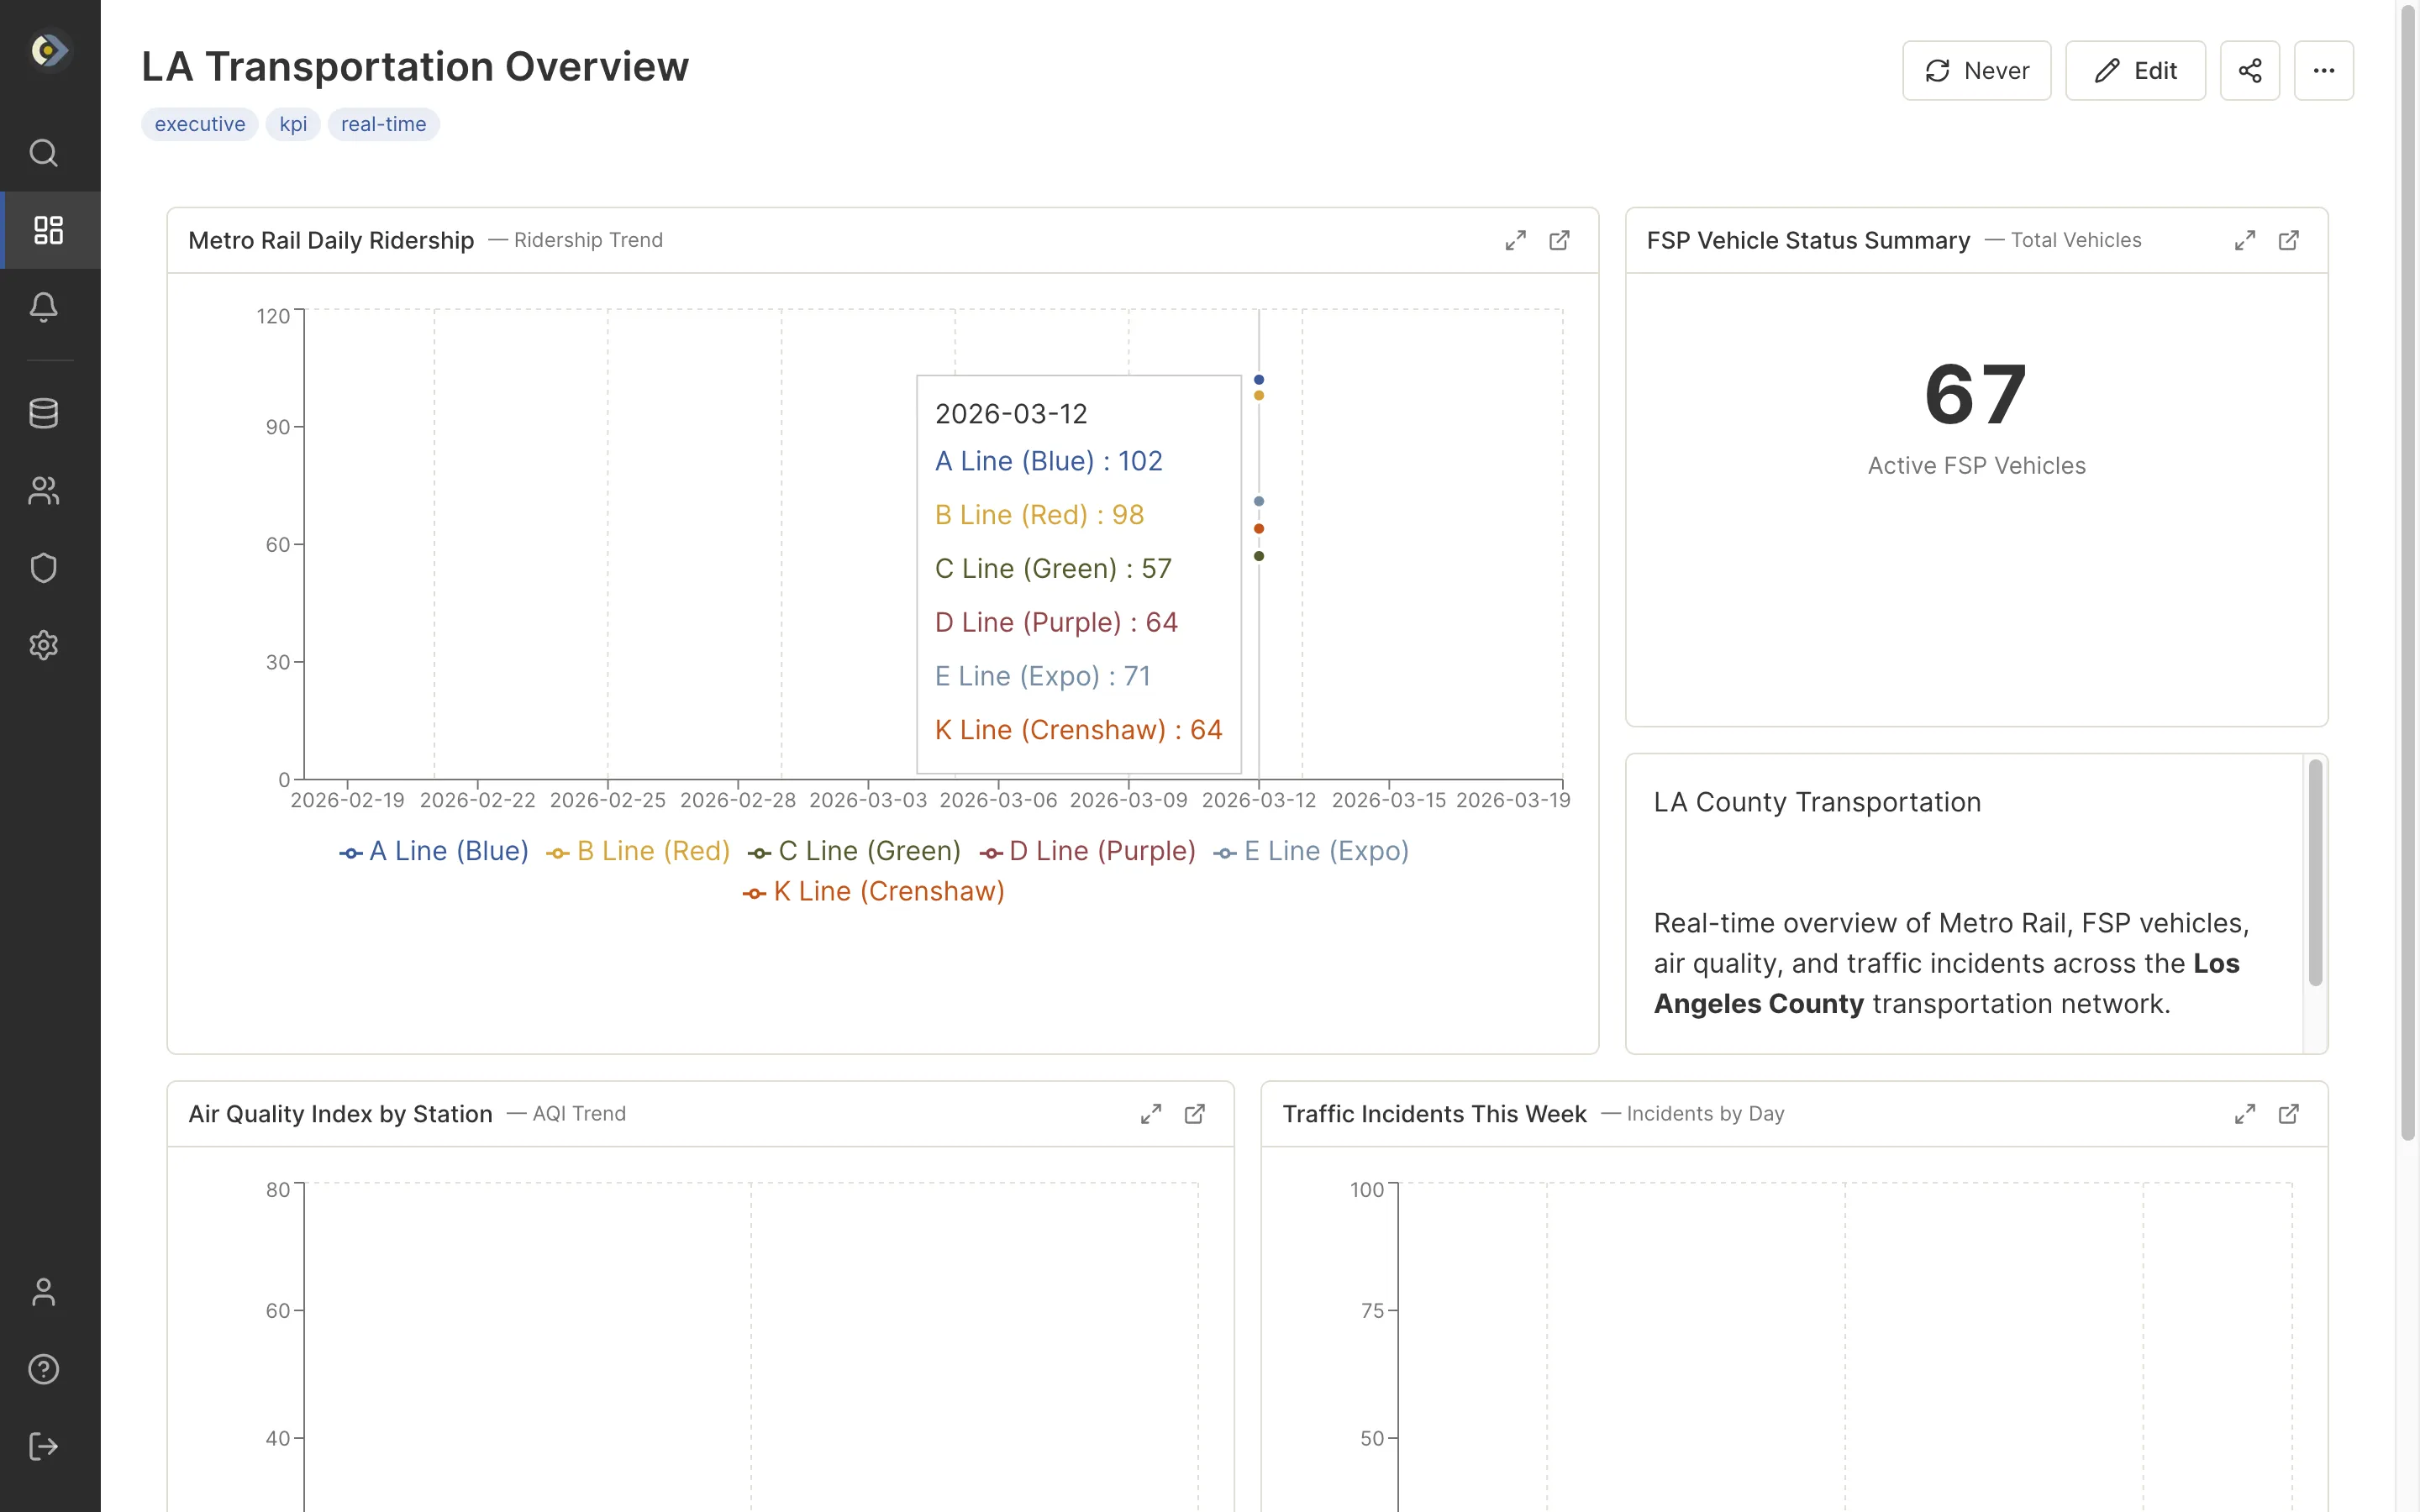
Dashboards combine charts, counters, and tables over the normalized warehouse.
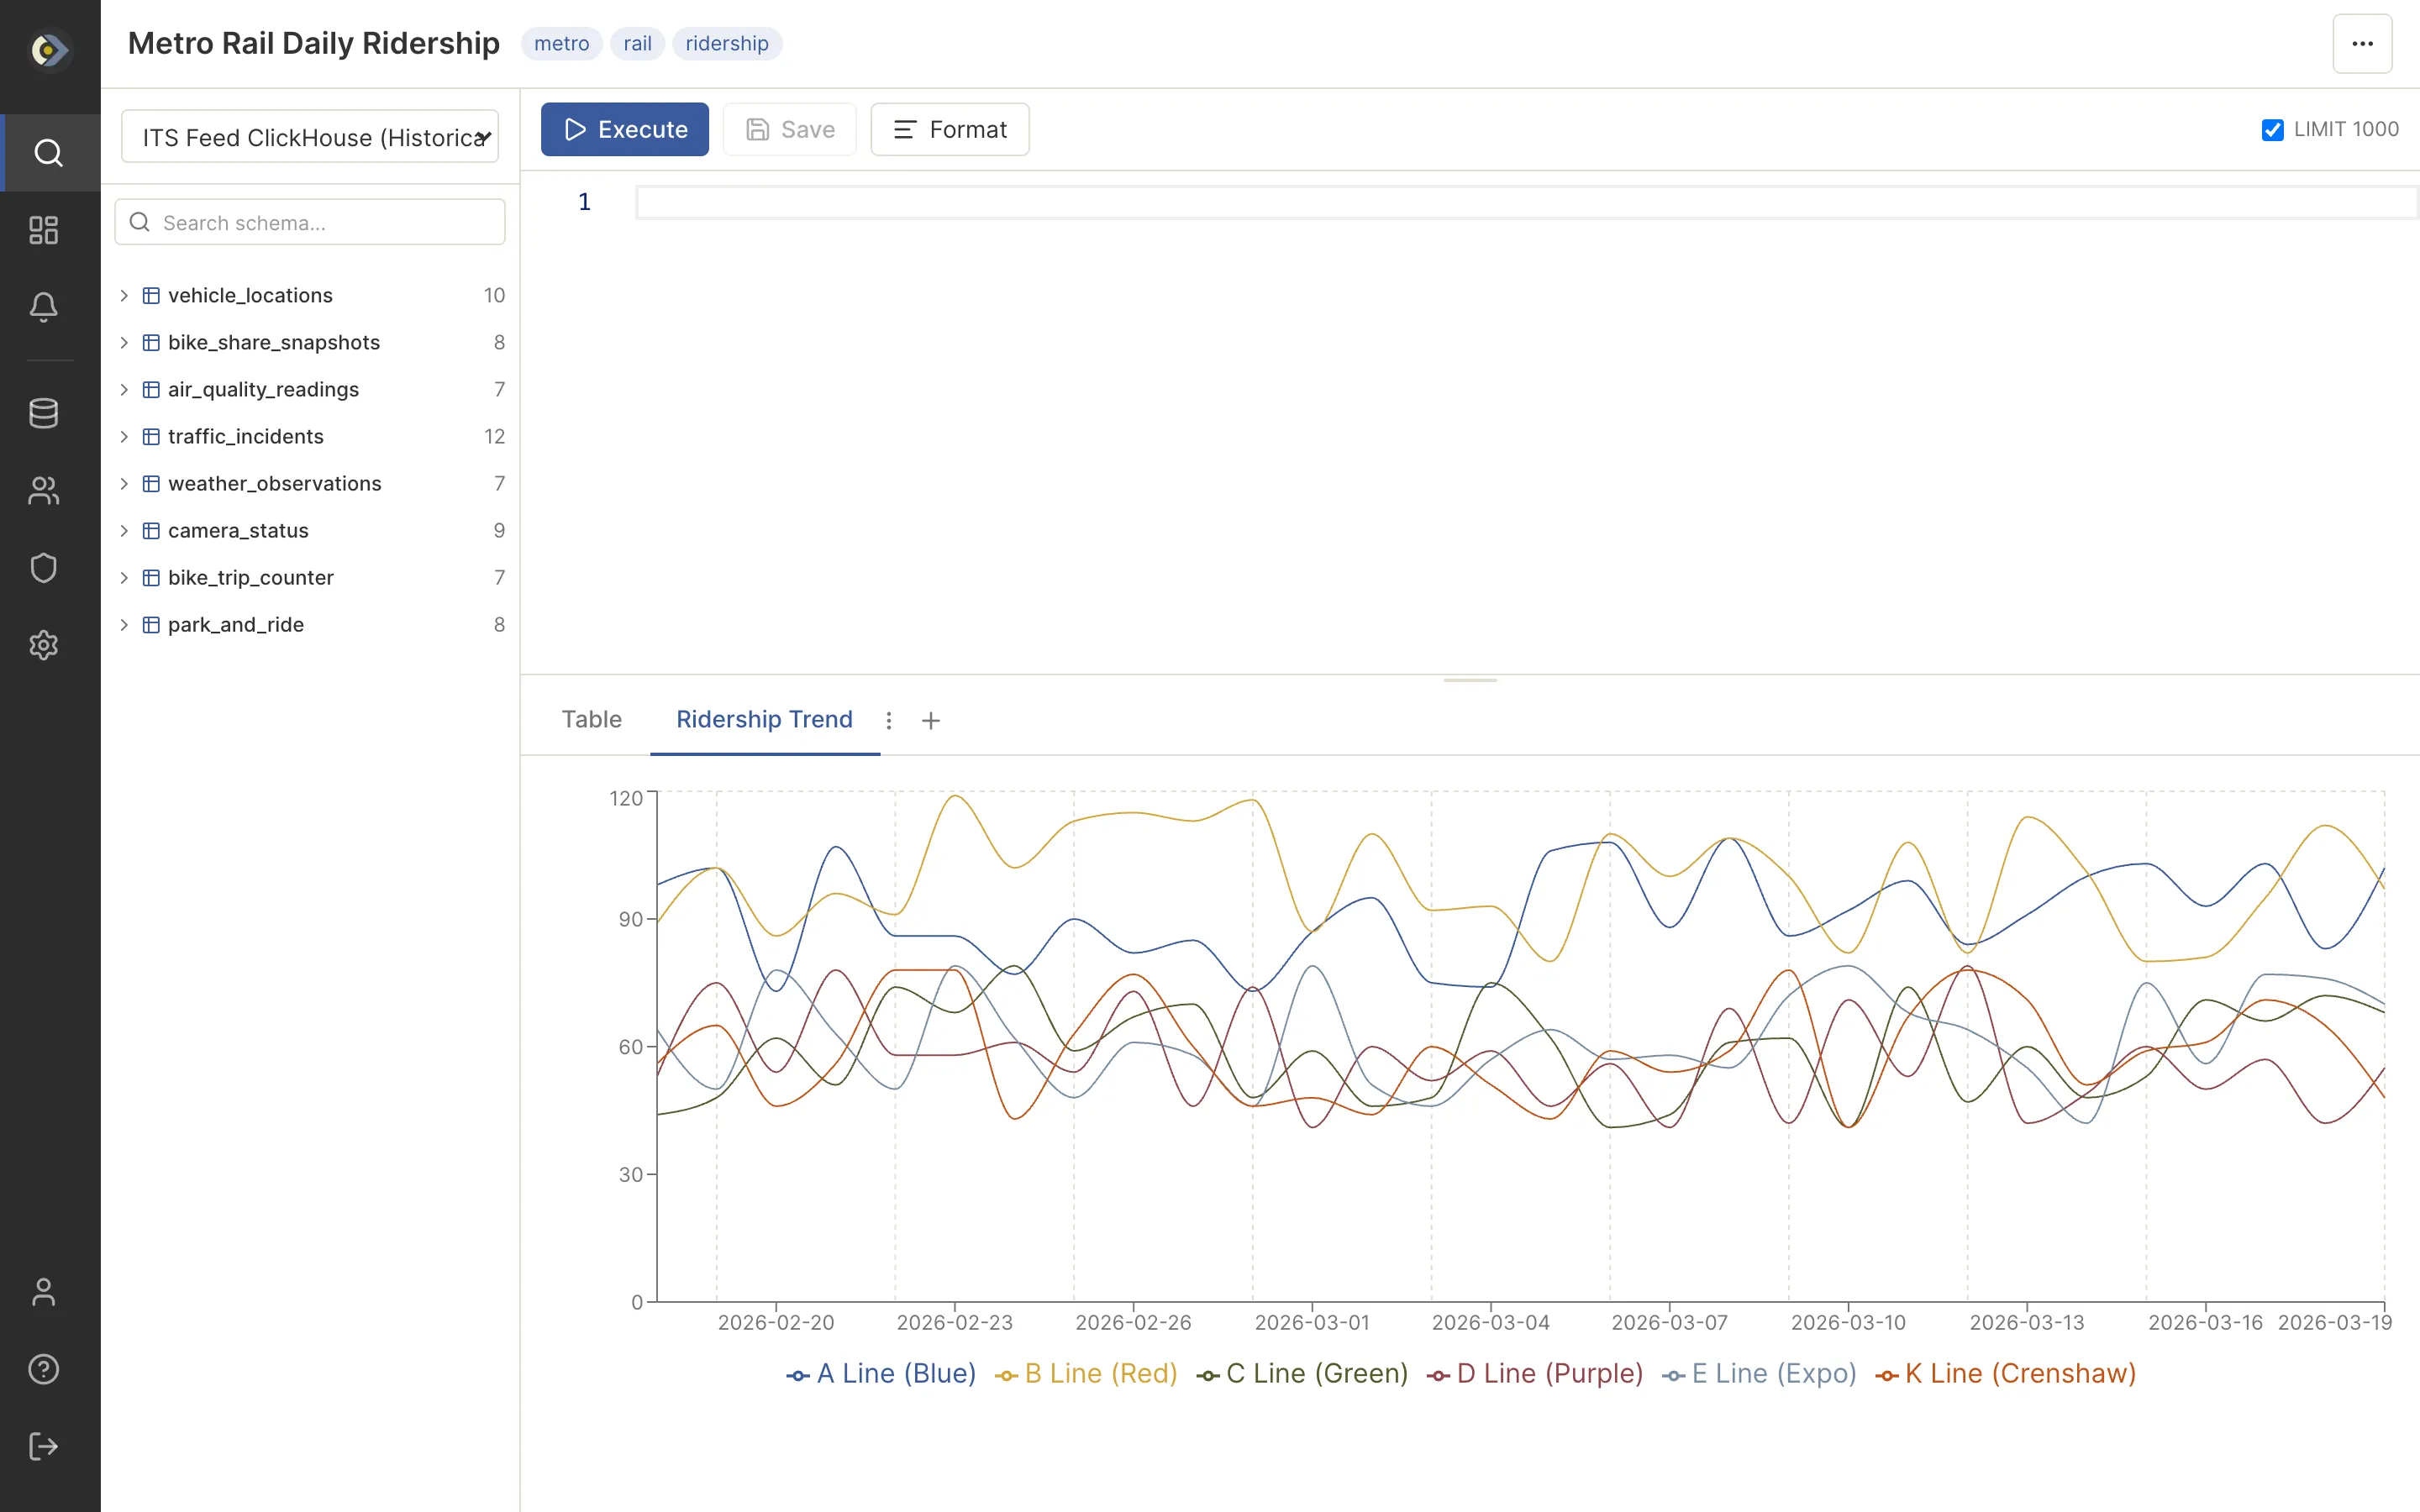
Author a query against any configured source and visualize the result inline.
Screens above show an example instance carrying Los Angeles County regional data.