Explainer · Agency IT
What a CAD/AVL system actually does
The box on the bus, the console in the control room, and the one message that leaves the building. We polled 92 open US vehicle-position feeds to see what a location report really carries and how old it is.
At 13:38 UTC on 2026-09-18, bus 3756 on SEPTA route 1 was at 40.1149559, -74.9862747, heading northeast at 47 degrees, working toward stop 27418 at stop sequence 111 of trip 868478, with many seats available. The position had been measured 36 seconds earlier. Everything in that sentence came out of one message in a public feed, and everything in that message came out of a box bolted into the dashboard of the bus.
That box, the radio network it talks over, the server it reports to, and the console a dispatcher watches are collectively what the industry calls CAD/AVL: computer-aided dispatch and automatic vehicle location. It is the system that knows where the buses are. The arrival time on the app, the countdown on the shelter sign and the agency’s own punctuality report are all downstream of it, and almost everything written about it is written by the companies selling it.
The two halves of the acronym
The two halves were separate products before they were one. Automatic vehicle location is the older idea, and the national architecture still treats it as its own thing. The US reference architecture for intelligent transportation systems gives it a service package of its own, PT01 Transit Vehicle Tracking, which “monitors current transit vehicle location using an Automated Vehicle Location System” and notes that the location data “may be used to determine real-time schedule adherence and update the transit system’s schedule in real-time.”
Computer-aided dispatch is the next package over, PT02 Transit Fixed-Route Operations, which “performs automated dispatch and system monitoring,” covers “the creation of schedules, blocks and runs, as well as operator assignment,” and “monitors the transit vehicle trip performance against the schedule and provides information displays at the Transit Management Center.”
Read those two together and the division of labor is clear enough: AVL answers where a vehicle is, and CAD answers what to do about it. In practice they are bought together, because the dispatch console is worthless without live positions and the positions are just dots until there is a schedule to compare them against.
The onboard half is usually one enclosure under or behind the dashboard, with a positioning receiver, a cellular modem, a small screen and keypad for the operator, and a wiring harness that reaches the door sensors, the destination sign, the announcement speakers, the fare device, and in many fleets the passenger counters over the doors. Agencies call it the mobile data terminal or the vehicle logic unit. What it connects to matters as much as what it tracks, because an agency that wants announcements, sign updates and passenger counts tied to the same trip has to route all of them through that one enclosure.
What a location report actually carries
The message leaving the vehicle is short. The one the public sees is shorter still, because it has been translated into GTFS-Realtime, the format almost every US agency uses to hand its positions to app developers. In the VehiclePosition message, every field except the entity’s identity is optional. What an agency actually publishes is therefore a decent proxy for what its CAD/AVL system collects and is willing to share.
So we measured it. The Mobility Database catalog snapshot we hold, taken 2026-08-21, lists 92 US vehicle-position feeds that are not deprecated and need no API key. We polled all of them six times at 45-second intervals between 13:33 and 13:37 UTC on 2026-09-18, which is mid-morning on the East Coast and early service on the West, and parsed every vehicle in every response. Feeds that answered carried 8,721 vehicles between them. Stripping out the rail and ferry feeds, which work differently and are covered below, leaves 61 bus feeds carrying 7,853 vehicles. Here is what those vehicles carried.
| Field | Bus feeds using it | Share of vehicles |
|---|---|---|
| Vehicle id | 61 of 61 | 100% |
| Position (latitude and longitude) | 61 of 61 | 100% |
| Timestamp of the position | 61 of 61 | 96% |
| Trip assignment | 61 of 61 | 91% |
| Bearing | 57 of 61 | 76% |
| Speed | 55 of 61 | 49% |
| Vehicle label | 51 of 61 | 78% |
| Occupancy status | 41 of 61 | 41% |
| Stop id | 38 of 61 | 58% |
| Current stop sequence | 33 of 61 | 52% |
| Schedule relationship | 28 of 61 | 30% |
| Current status, set explicitly | 25 of 61 | 39% |
| Occupancy percentage | 10 of 61 | 17% |
| Congestion level | 7 of 61 | 3% |
| Odometer | 6 of 61 | 12% |
| License plate | 1 of 61 | 1% |
| Wheelchair accessibility | 0 of 61 | 0% |
That table is the answer to what a location report contains. Identity, place, time and trip are in every feed, and heading is in all but four. Everything below that line is something the agency decided to publish, and most of them decided not to.
Look twice at two of those rows. Occupancy, the field that tells a rider whether there is room on the bus, is present in two thirds of feeds but on fewer than half of vehicles, because agencies that have passenger counters on part of the fleet publish occupancy for part of the fleet. Congestion level, which was meant to let a vehicle report the traffic it is sitting in, has effectively not been adopted: seven feeds carry it at all. Where anyone needs that number, it is easier to derive it from the position history than to ask the bus for it.
The two fields at the bottom of the table are absent for opposite reasons. A
license plate is a specific, public identifier of a specific vehicle, and one
agency in 61 chose to publish it. Wheelchair accessibility is missing because it
is already answered elsewhere: GTFS has a wheelchair_accessible field at the
trip level in the schedule feed, so the realtime message has nothing to add
unless the lift on a particular bus has failed.
How old the position is when you get it
Cadence is where the change of the last two decades shows up. The reference point is TCRP Synthesis 73, AVL Systems for Bus Transit: Update, published by the Transportation Research Board in 2008. Its survey went to 107 transit agencies and 32 answered. Question 15 asked at what interval location reports were received from any particular vehicle. The average answer was 95 seconds. The shortest was 15 seconds, the longest was 300, and the most common single answer was 120 seconds, given by 11 of the responding agencies. The report notes that a long regular polling interval was typically supplemented by exception reports, sent when a bus crossed a schedule-deviation threshold.
Our measurement is not the same quantity, and the difference matters. We can see how old the newest report for each vehicle was at the moment the feed was assembled, which is a floor on the reporting interval rather than the interval itself. Taking the median across each feed’s six polls, and setting aside one feed that served an identical frozen message for the whole four minutes, the middle bus feed was publishing positions 7 seconds old. Freshness was under 15 seconds in 46 of the 60 remaining feeds and under 30 seconds in 57 of them. The slowest was serving positions 35 seconds old, which in 2008 would have been at the fast end of what anyone reported.
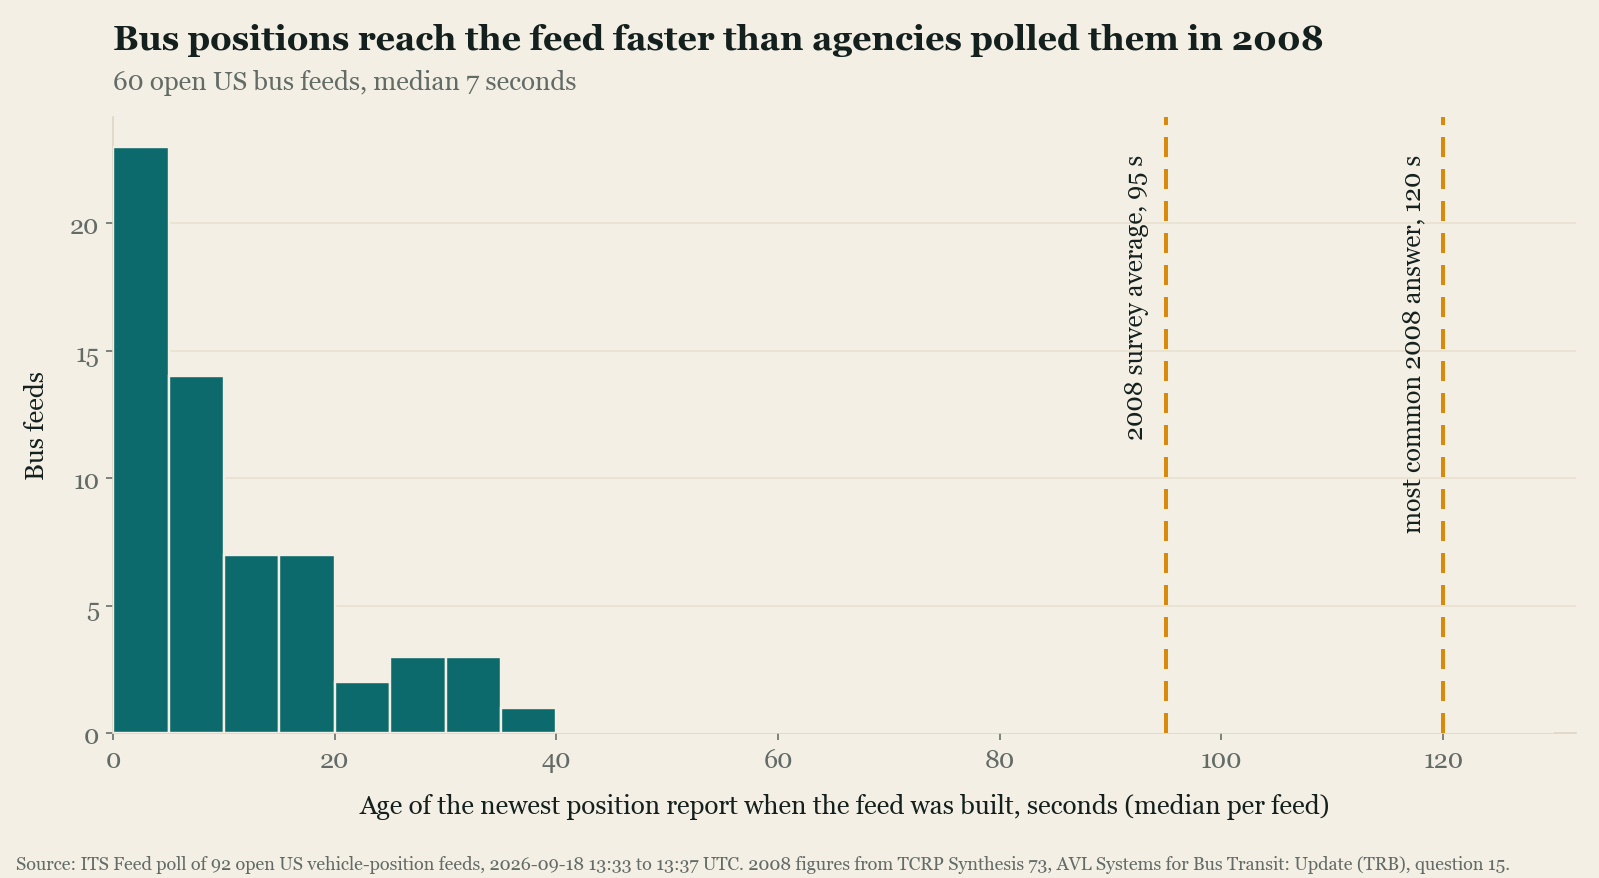
The closer analog to the 2008 question is how many vehicles get a new measurement between two polls. In the 51 bus feeds with enough vehicles in common across consecutive polls to check, the median feed replaced the timestamp on 98 percent of its vehicles within 45 seconds, and 44 of the 51 replaced at least 90 percent. Whatever the interval is on those fleets, it is comfortably under three quarters of a minute. The frozen feed, Des Moines Area Regional Transit, changed nothing at all: the same 35 vehicles, the same timestamps, six times in a row.
One check is worth reporting because it is the first thing a skeptic should ask. A vendor that stamps the server’s own clock onto every vehicle at feed-build time would produce an age near zero and a perfect refresh rate while telling you nothing about the buses. In every feed carrying at least ten vehicles, the timestamps within a single response were spread across many distinct values, so none of them is stamping wholesale. The two feeds that did show a single shared timestamp carry seven and eight vehicles respectively, too few to conclude anything from.
A vehicle position without a position
The rail feeds we set aside make a useful point about what the acronym covers. All seven New York City subway feeds and the Staten Island Railway feed carry no latitude or longitude whatsoever, while the Long Island Rail Road feed from the same agency carries one on every train. A subway train entity is a trip identifier, a stop id, a stop sequence, a status of stopped at or in transit to, and a timestamp. Here is a complete A train, exactly as the feed served it:
id: "000002A"
vehicle {
  trip { trip_id: "047000_A..N82R"  start_time: "07:50:15"
         start_date: "20260918"  route_id: "A" }
  current_stop_sequence: 32
  current_status: STOPPED_AT
  timestamp: 1789738722
  stop_id: "A07N"
}
That is not a gap in the feed. A satellite receiver is useless in a tunnel, so an underground railroad locates its trains by where they are in the signal system rather than by coordinate, and the feed reports the result the same way: this train is stopped at this platform, which is the answer a subway rider wants in any case. Bus CAD/AVL and rail train tracking publish into the same message format and are different systems doing different jobs, which is worth remembering before comparing a subway feed to a bus feed on anything.
What the dispatcher is looking at
The console is the part nobody outside the control room ever sees. It is a map of the service area with every vehicle on it, and next to the map a list, sorted by how much trouble each vehicle is in. Trouble means deviation from the schedule, and deviation is computed at timepoints, the subset of stops where the schedule publishes a specific time rather than a passing estimate.
Each agency sets its own definition of late, and the software enforces whichever one it was given. The Rhode Island Public Transit Authority’s service guidelines, published January 2025, put it plainly: RIPTA “measures on-time performance at each timepoint on a route, with on-time defined as no more than one minute early and no more than five minutes late,” and sets a goal that 80 percent of service departs each timepoint inside that window. The asymmetry is deliberate, and RIPTA gives the reason: early service “often impacts passengers more than late departures as the wait for the next bus is almost always longer than the short hold time.” A rider who arrives on time and finds the bus already gone waits a full headway.
The guidelines also describe the operational consequence, which is the clearest statement we found of what CAD/AVL is for: buses running early “hold at timepoints until a scheduled departure time, while those that are running on-time or late operate straight through.” The system computes the deviation, the number appears on the operator’s display, and the bus sits at the curb. No dispatcher has to be involved at all.
Measuring any of this used to mean sending people out to stand at timepoints with clipboards, and agencies were often wrong about their own performance until the location data arrived. Among the open-ended answers TCRP collected in 2008 about what changed after implementation, one agency reported simply: “Before implementation, we believed that our on-time performance was much better than what the system is telling us.”
The definition is not settled even now. San Francisco’s Muni has taken its on-time performance report offline entirely, saying that two new reports are in development that “will more accurately reflect the blend of on-time performance and headway adherence that better reflect rider experience.” On a route where a bus comes every six minutes, schedule adherence is close to meaningless and the thing worth measuring is whether the buses are evenly spaced. RIPTA’s guidelines already make that split explicit, measuring its rapid routes on bunching and gapping instead, with bunched defined as less than two minutes between buses.
When a bus leaves the route
The other half of dispatch is exceptions. A fixed-route bus is supposed to trace a known shape, and the CAD/AVL system holds that shape, so a vehicle that is not on it is a detectable event rather than something a dispatcher has to notice. Off-route detection, schedule-deviation alarms above a threshold, missed trips, and the silent alarm an operator can trigger from the keypad are all the same mechanism: a condition evaluated onboard or at the server, and an entry that appears at the top of somebody’s queue.
Exception reporting is also a communications strategy, and it predates cheap cellular data. The 2008 report describes agencies supplementing a long polling interval with reports sent only when a bus crossed a deviation threshold, because radio bandwidth was the constraint. That constraint is gone and the workflow it produced stayed. What a dispatcher uses all day is the ordered list of things that need a decision, plus the record that the decision was made. The map is scenery.
Not every vehicle in a feed is running a trip. Across the bus feeds we polled, 9 percent of vehicles carried no trip assignment at all. Some of those are deadheading to or from the garage, some are on a break between blocks, some are logged in without an assignment because the operator has not entered a run number. A dispatcher cares about all of them. A rider-facing app usually drops them on the floor.
Where the data goes after the console
The same box feeds four different consumers, and they get run together constantly in writing about this layer.
The first is the public feed, which is what we measured, and it is a lossy translation of the internal record. The second is the prediction engine, which takes the position stream and estimates arrival times downstream. That is a separate job with its own failure modes, covered in our piece on how real-time arrival predictions actually work, and it is where most rider-visible errors, including ghost buses, actually originate. The third is the archive: yesterday’s positions, stored, are what running-time analysis and performance reporting are built on, and there is now an open format for that archive in TIDES. The fourth is the set of onboard subsystems the box drives directly, which is why a fault in the onboard unit tends to take the announcements and the destination sign with it. On a corridor with transit signal priority, the question of whether a bus is late enough to deserve a few more seconds of green is answered from this same location and schedule data, so a priority request inherits whatever that data already got wrong.
Federal reporting sits alongside these rather than inside them. The National Transit Database collects service and ridership counts on its own schedule and with its own rules, and what an agency may use to produce those counts is a separate question from what its dispatch system happens to record.
What the open feeds say about the installed base
The catalog snapshot is a rough census of who has any of this. It lists 833 live US schedule feeds and 153 vehicle-position feeds attached to them, so fewer than one in five feeds with a published timetable has live positions alongside it. Of those 153, 148 also publish trip updates, which means that at this point an agency that can produce positions can nearly always produce predictions too. Publishing is not the same as owning, in either direction: an agency can run CAD/AVL and keep the output private, and a very small operator can put trackers on five vans and publish without anything resembling a dispatch system. As a floor on how much of US transit has nothing watching the fleet, though, the gap between 833 and 153 is the number to argue with.
The state of the feeds themselves is its own finding. Of the 92 open feeds we
polled, 73 answered with vehicles on the URL the catalog gives. Five more
answered once the URL was repaired by hand, and the repairs are instructive: C-TRAN’s
cataloged path spells it VehiclePostions, Kitsap Transit’s carries a ?debug
parameter that returns the protobuf text format instead of protobuf, Lane Transit
District’s points at the static schedule zip rather than a realtime feed,
Foothill Transit’s carries a serverid=0 parameter that makes the server return
a valid but empty message, and CobbLinc’s carries Debug=True and returns JSON.
Every one of those is a live feed that a naive consumer would record as broken.
Another two answered and were empty. Central Ohio Transit Authority’s returned zero vehicles through all six polls, at 09:33 on a Friday morning in Columbus. Big Blue Bus in Santa Monica returned a well-formed, completely empty message stamped 2025-04-09, which is to say its vehicle-position feed has been serving the same frozen header for more than 500 days. The remaining twelve did not serve a feed at all: one hostname no longer resolves, three connections time out, one host has no route, one returns a 503 and another a 404, two return 403, one serves an HTML page where the protobuf should be, and two cataloged as open now sit behind an API key.
What to watch
Cadence has stopped being the interesting variable, on the open feeds at least. When the median bus feed is serving positions seven seconds old, what limits a rider’s experience is everything after the position arrives: whether the trip assignment is right, whether the prediction model handles the layover, whether the operator logged into the correct run.
The fields past the position are where the next differences will show up. Occupancy is published by two thirds of bus feeds and populated on 41 percent of vehicles, and closing that gap is usually a hardware purchase rather than a software one. Schedule relationship, the field that says whether a vehicle is running a scheduled trip or an extra one, is set on 30 percent of vehicles, so a consumer looking at a trip it cannot match to the timetable has no way to tell an added bus from a bad identifier.
And the catalog rot is worth watching for its own sake. Five of 92 cataloged URLs were wrong in ways that any automated consumer would silently treat as an outage, and one feed has been frozen since April 2025 while the catalog still lists it as live. For most of these agencies the feed is the only part of the system anyone outside the building can look at, which makes the error rate on it worth knowing.
All counts here are point-in-time, measured 2026-09-18 against a catalog snapshot taken 2026-08-21, and describe feeds rather than agencies. One operator can publish eight of them.
Common questions
- What is a CAD/AVL system in transit?
- CAD/AVL stands for computer-aided dispatch and automatic vehicle location. It is the pair of systems an agency runs to know where every vehicle is and to direct the people driving them. The AVL half puts a positioning receiver and a data radio on each vehicle and reports its location back on an interval. The CAD half gives dispatchers a console showing every vehicle against its schedule, a message channel to operators, and a record of what was done about each problem.
- What does a vehicle location report contain?
- At minimum a vehicle identifier, a latitude and longitude, and the time the position was measured. Most also carry the trip the vehicle is running, a heading, and the stop it is working toward. In a poll of 61 open US bus feeds on 2026-09-18, every feed carried a position, a vehicle id and a timestamp, 93 percent carried a heading, 90 percent carried speed, 67 percent carried an occupancy reading, and 10 percent carried an odometer.
- How often does a bus report its location?
- Far more often than it used to. A 2008 TRB survey found an average reported polling interval of 95 seconds, most commonly 120 seconds. In a 2026-09-18 poll of open US bus feeds, the median feed served positions that were 7 seconds old, and in 44 of the 51 feeds with enough overlap to check, at least 90 percent of vehicles carried a new position timestamp within 45 seconds.
- Is CAD/AVL the same thing as a real-time arrival prediction system?
- No. CAD/AVL produces the location and schedule-adherence record. A prediction engine consumes that record and estimates when a vehicle will reach each stop downstream. They are usually bought together and are often the same vendor, but they are separate jobs, and the prediction is only as good as the location reports feeding it.
- Does every transit agency with a GTFS feed have CAD/AVL?
- No. In a snapshot of the Mobility Database catalog taken 2026-08-21, 833 live US schedule feeds were listed and 153 of them had a vehicle-positions feed alongside. Publishing positions is not the same as running CAD/AVL, in either direction, but the gap is a reasonable floor for how many US agencies have nothing tracking their fleet in real time.
- What does 'on time' mean to a CAD/AVL system?
- Whatever the agency told it. RIPTA's January 2025 service guidelines define on time as departing a timepoint no more than one minute early and no more than five minutes late, with a goal of 80 percent of service inside that window. Other agencies set different tolerances, so the same bus can be on time in one city and late in another.